Writing a Better Blog Post, an @Tint Case Study

I’ll admit it, Team Tint hasn’t looked at our blog’s analytics data as much as we should have. We blog multiple times a week, likely spending more than 8 hours a week, and we are committed to Content as a part of our inbound marketing strategy. However, we haven’t spent the necessary time to look deeper at the data we have. So, this post is the long overdue self-examination that will hopefully answer a couple of questions we have on what’s working on our blog, what’s not, and what we can do next.
Questions We Want to Answer
- What kind of content sees the most views and shares?
- What kind of content gets the hottest leads?
- How did our Popular Posts get Distribution?
Before answering these questions, let’s take a look at our most/least popular posts by pageviews. (Note: All of the metrics are from when the blog began until yesterday)
Hightest Performing Posts by Page Views
- 5 Steps to Increase Likes for your Facebook Page - 103,172
- The Ultimate Guide on How to Get more Followers on Instagram - 90,610
- How to Find any Email Address Contact in 2 Minutes - 35,014
- How To Use Trello Effectively - 10,825
- The Ultimate Guide on How to Cold Email Effectively - 9,622
- Improve SEO: How we increased search traffic by 2600% - 8,954
- How to Create A KPI Dashboard - 3,608
Lowest Performing Posts by Page Views
- Social Hubs: A Complete Guide - 1,336
- How to Blog and Acquire More Customers with It - 267
- How to be Productive - 134
What kind of content sees the most views and shares?
From the above posts, we can see that the posts with the most specific topics and keywords performed the best. The worst were generic articles about topics that are highly competitive, where we would be less likely to capture long tail keywords or generate any interest from our social media and email newsletter audiences. So, before you launch a post or go into great detail, imagine yourself to be a part of your target audience (in our case, the social media marketer) and answer the following questions:
Questions to ask yourself before/during writing:
- If I read the first paragraph, would I read the rest of the paragraphs?
- If I shared the article on my social networks, would I look dumber, or smarter?
- If I skimmed the article in 20 seconds, is there something I could remember and add to my body of knowledge? - this could definitely be something visual, like a large quote, embedded tweet, or image!
If your content can satisfy these questions, you’ll be rewarded with people using your content to look smart:
I like these principles: How @Tint Hit 90k per Month in 9 Months with a 4 Man Team http://t.co/tXYTn2kVlV via @prismatic
— John McLaughlin (@johnmcl69) November 8, 2013
And finding that your article evokes an emotion:
“@Idealab: How @Tint Hit 90k per Month in 9 Months with a 4 Man Team http://t.co/Z0Vor6WMtq - Congratulations!” Love this team
— John Neil Conkle (@JohnNeilConkle) November 8, 2013
How did our Popular Posts get Distribution?
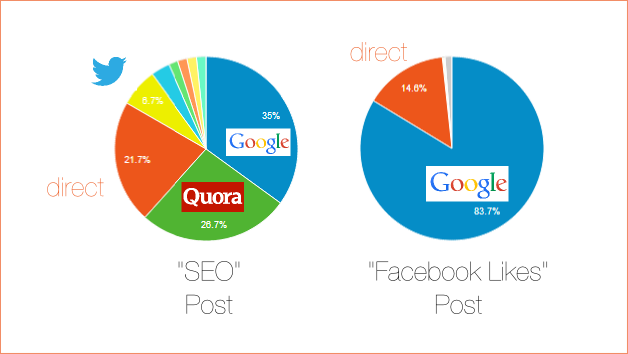
- “5 Steps to Increase Likes” had a majority of its distribution by Google (84% search). Important keywords included: “how to increase facebook likes” (22%), “how to increase likes on facebook” (18%), and “how to increase likes on facebook page” (14%).
- “Improve SEO: How we increased search traffic by 2600%” had a much more diverse selection of referrers, including Quora (26%), Direct Link(22%), and Twitter (7%). Organic search only contributed 35% of referrer traffic.
The pie graphs above illustrate the referrer diversity between posts of different types. A post that is SEO targetted will get the majority of its traffic through search, whereas a post more suited for sharing will find distribution through a variety of sources. We think this is a healthy way to diversify one’s traffic portfolio to keep from being too dependent on one source. Also, it highlights the importance of reaching all possible vectors of sharing if your post is of the “sharable” variety.
Key Takeaway: Distribution is just as important as the actual content. Find relevant Quora questions, make sure there is a chance of ranking for a keyword, and share on social at the right times to the audience, and most importantly grow a community through your email newsletter following. Distribution takes time, research, and work, and there’s no easy way around it. At the same time, neglecting distribution of content results in valuable posts that are never read.
An example of an auxilliary channel such as Quora can increase your post’s distribution:
Awesome answer by @ryochiba to What are some of the most ingenious ways to increase traffic to a website? http://t.co/4TZnXw5KiB
— SumAll (@SumAll) July 24, 2013
What kind of content gets the hottest leads?
Now that we’ve discussed distribution, let’s look at what users do once after they’ve read our content. So, examining the most important metric: Converting audience members into customers.
Highest Performing Posts by User Activation (user clicked ‘generate embed’)
- 5 Steps to Increase Likes for your Facebook Page - 267 conversions
- How to Convince Developers and Designers to Join your Startup/ - 134 conversions
- Compare this to our Instagram Widget landing page that got 1,736 conversions!
Upon examining the number of people who activated our product after landing on a blog post, we surprisingly found that our blog posts were contributing very little to conversions to our product. Instead, our blog’s keyword-targetted landing pages were creating the vast majority of conversions. It’s great that our landing pages were converting, but we know that we can do better from our blog. So this was definitely an important find as a place for improvement.
Key Takeaway: Pageviews does not necessarily translate into customers! Don’t fall into the trap of only looking at vanity metrics. We made this mistake, and moving forward, we’ll be attempting to increase conversions by looking at improving our blog’s Calls-To-Action that highlight the value of our product.
How to Write A Better Post - Summary
- Put yourself in the shoes of your audience. Would you share your own post and be proud of it?
- Distribution is just as important as content quality, so follow through and utilize every possible channel!
- Great content does not necessarily translate into customers. Pay attention to conversion rate, and improve CTA’s.